
Freenalytics
[Research]An open source, self-hosted dashboard for usage analytics of general use applications.
Status:
Technologies:
Stats from GitHub:
1
Stars
0
Forks
1
Watchers
0
Open Issues
As part of a requirement to obtain higher education degrees, students typically need to complete an intensive exam, a research paper (thesis) or a capstone project. In my university, and in my career specifically, students need to complete a capstone project to finally graduate.
These projects are usually accomplished with the guidance of a teacher that will act as a counselor to guide the student during the project. When it comes to the project's theme, it is typically the student's choice, but the counselor can also suggest their own for the indecisive students.
In my case, I decided I wanted to apply as many of software development best practices in my project, so I knew I wanted to build a complete piece of software built with TDD and with a CI/CD system in place as my final career project. This is when Freenalytics came into existence (nevermind the lame name, I am terrible at naming projects, you'll notice that if you read any of my other articles), a self-hosted log aggregation service for any type of application.
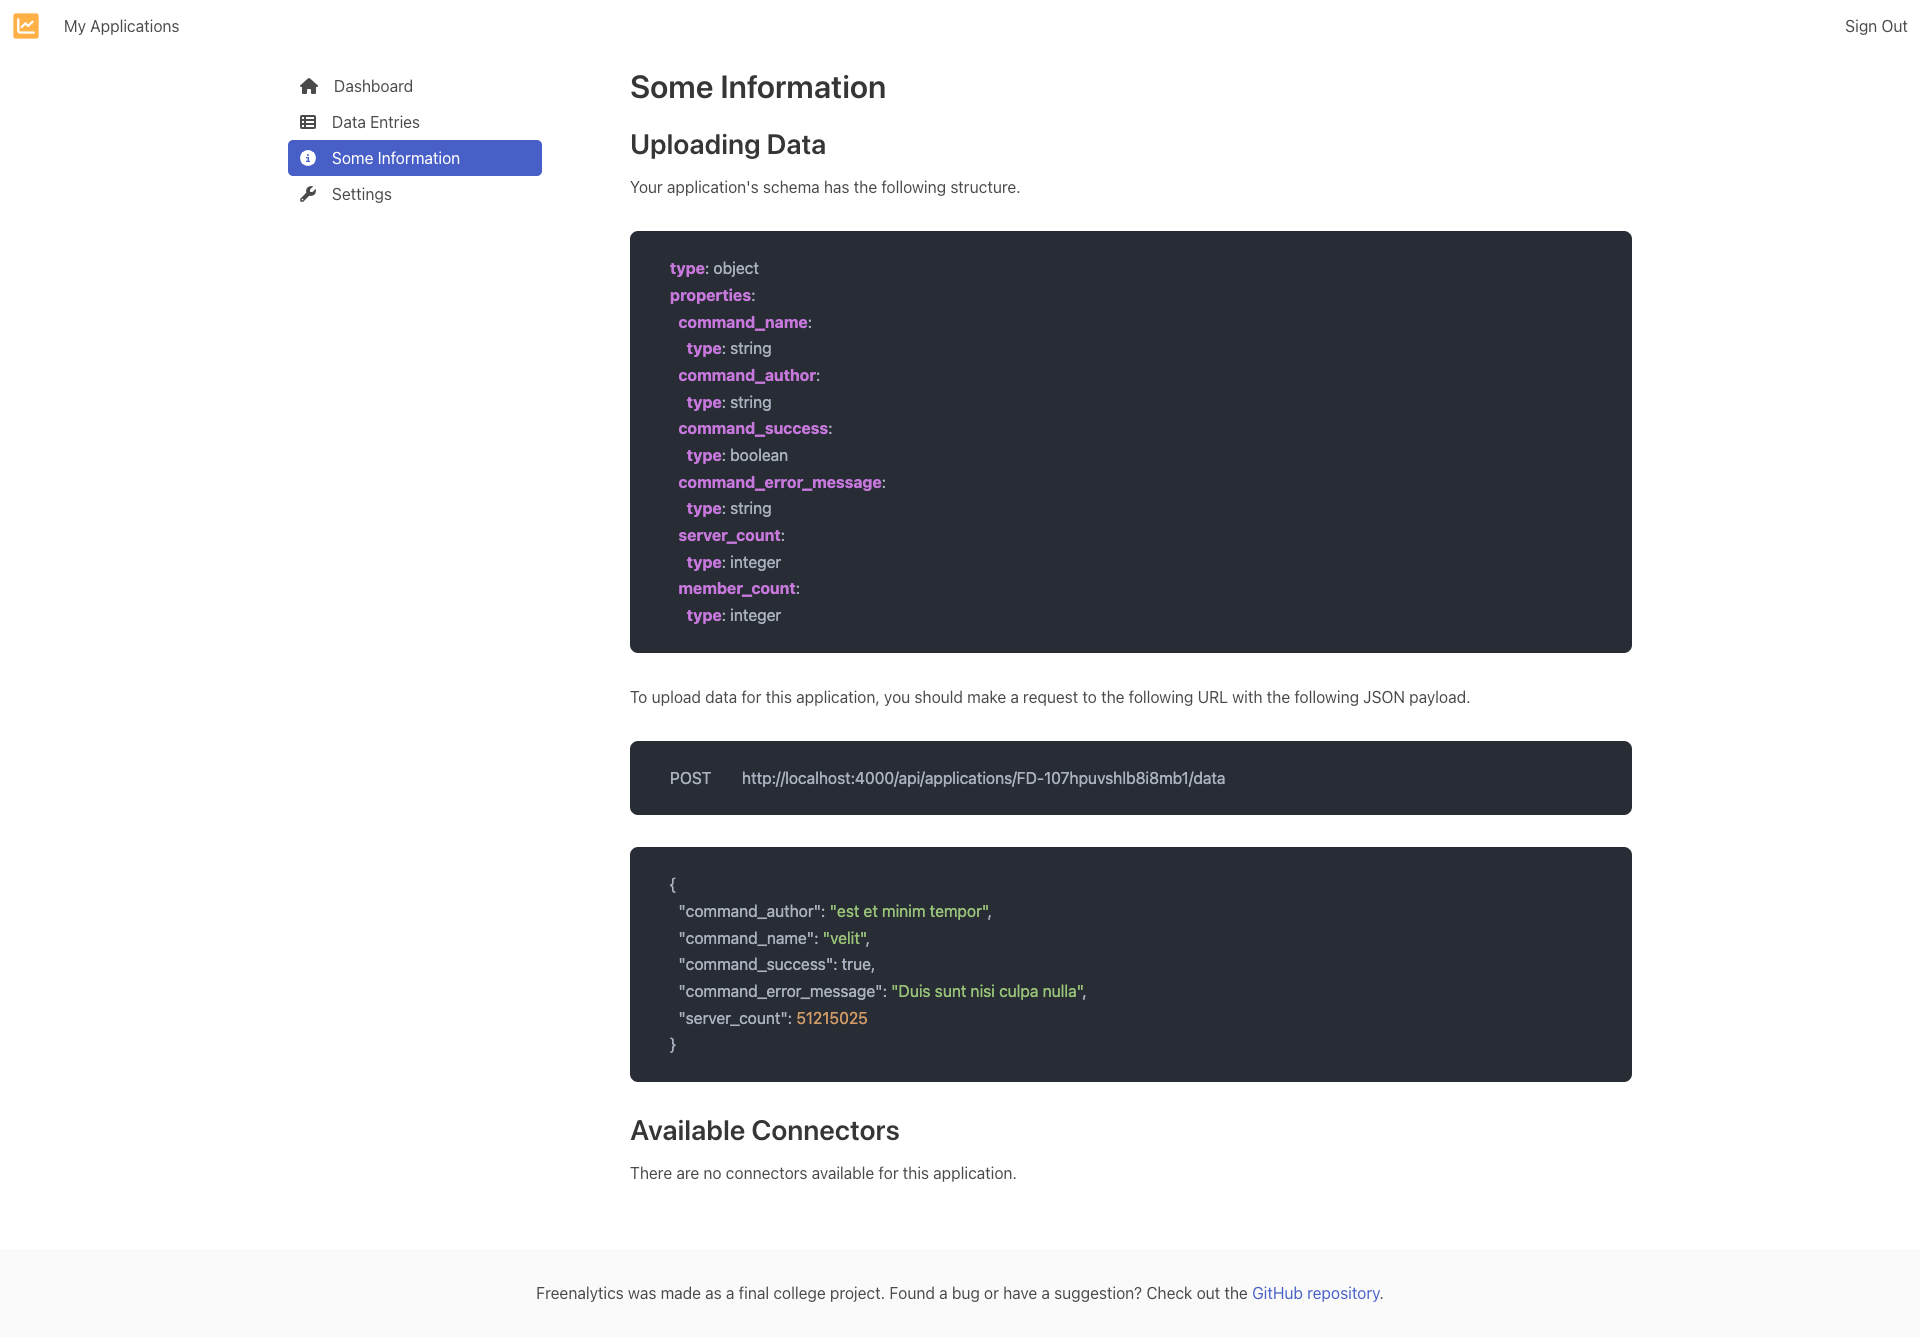
Freenalytics in its essence is a log aggregation service that stores data sent by other applications through a REST API. The structure of the data is defined through a JSON Schema, which also serves as a way to validate data coming in, and as a way to define how it is displayed in a Dashboard. Depending on the type of data, you may find line or pie graphs, tables or simple counters for each property saved.
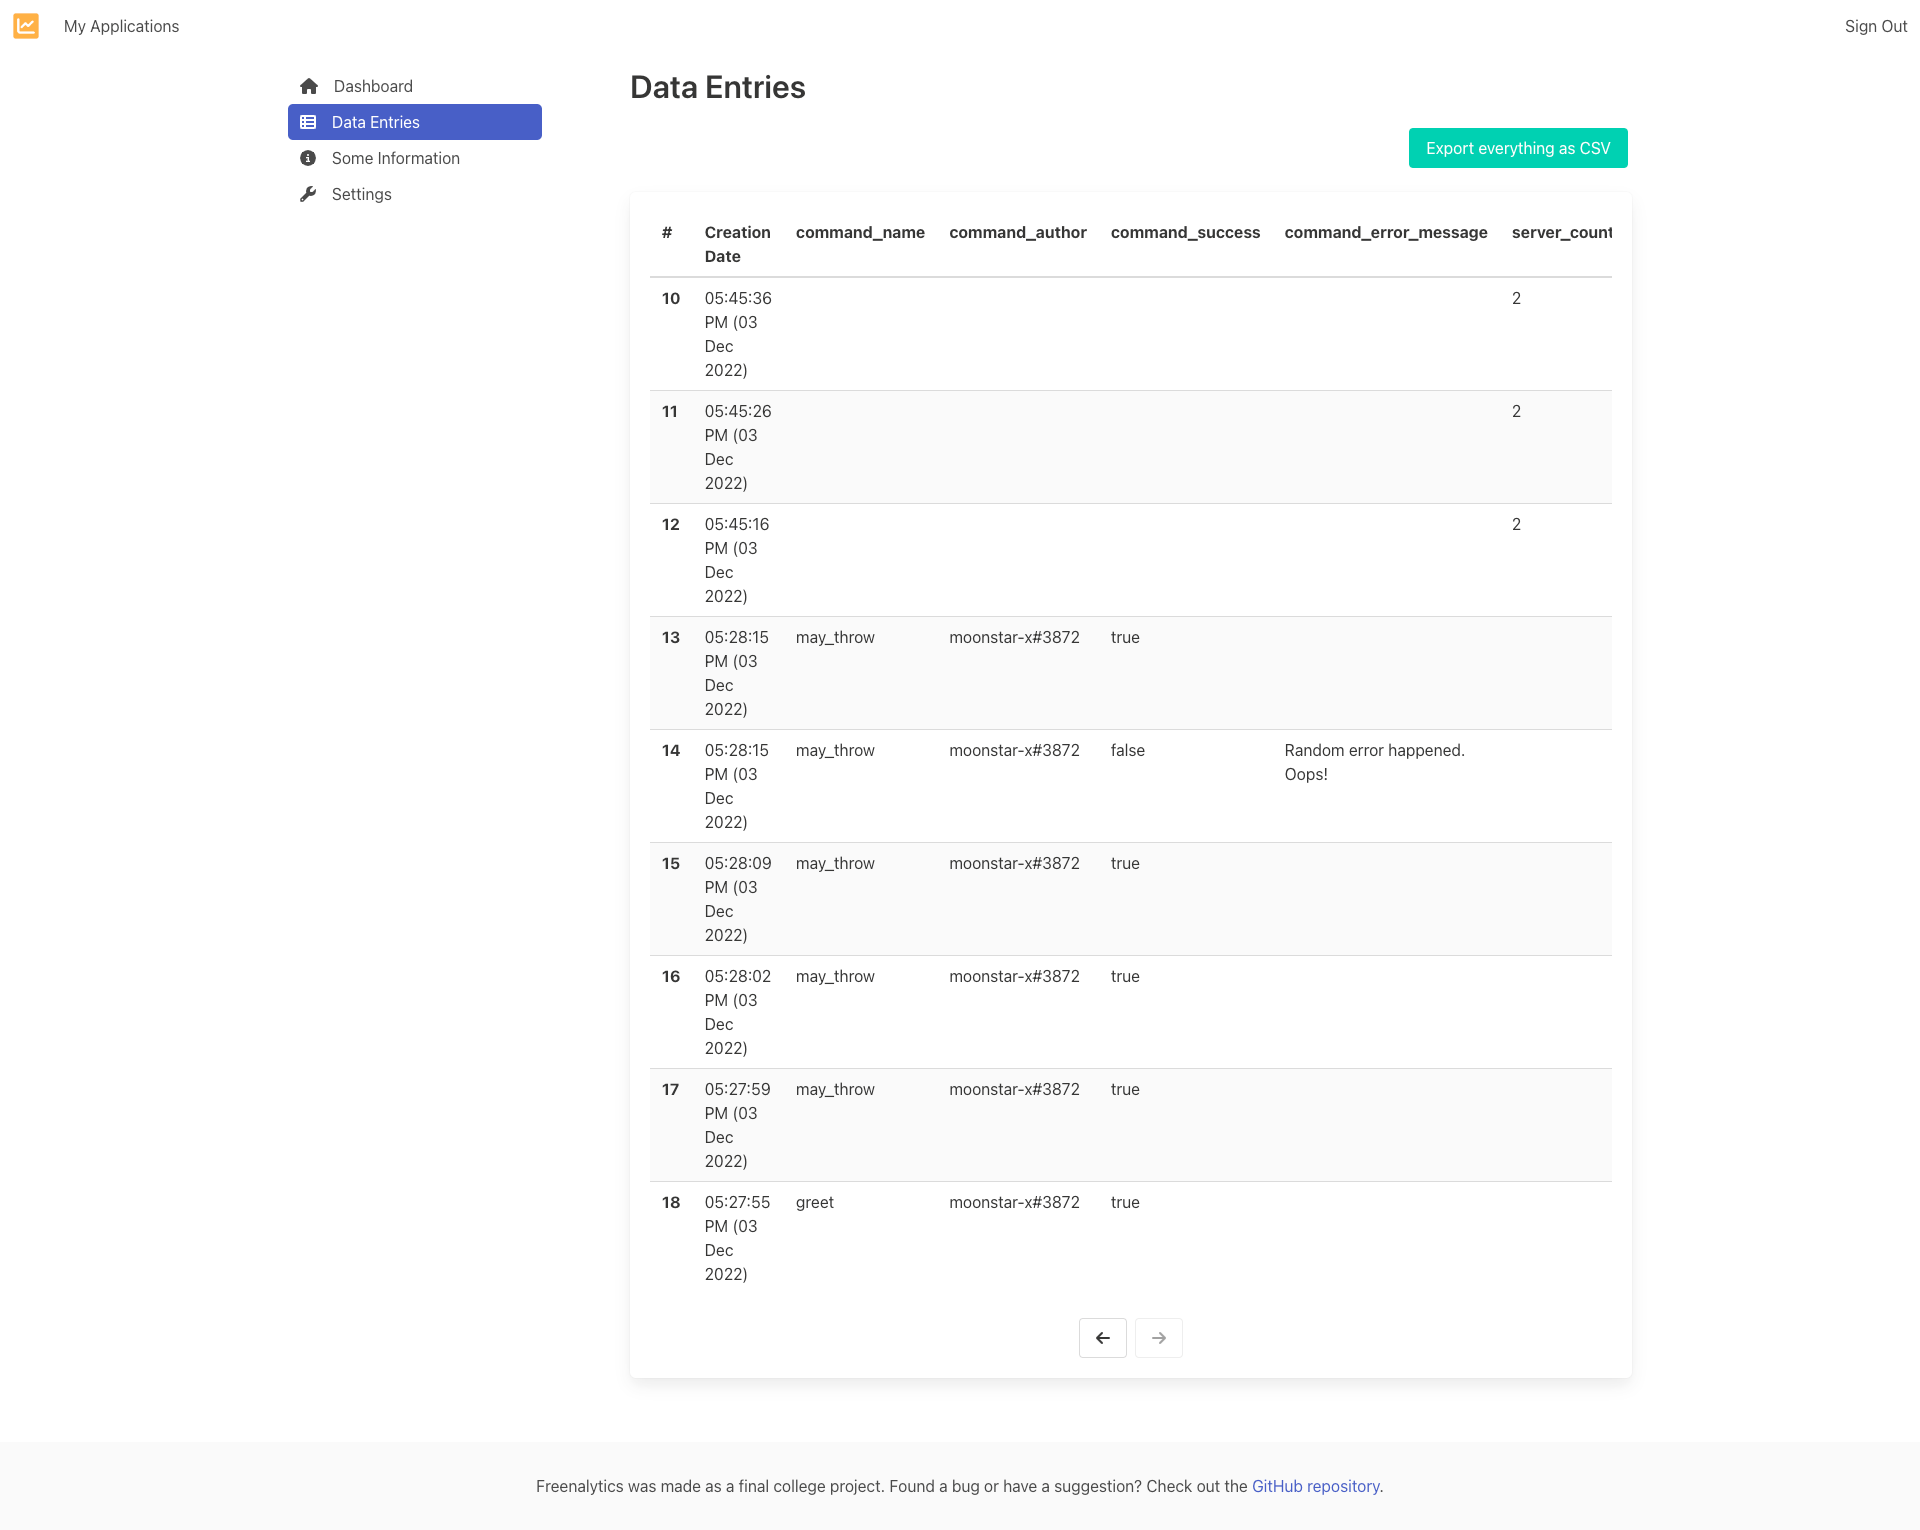
The Dashboard includes a table view of all data entries and an option to export as a CSV for further treatment.
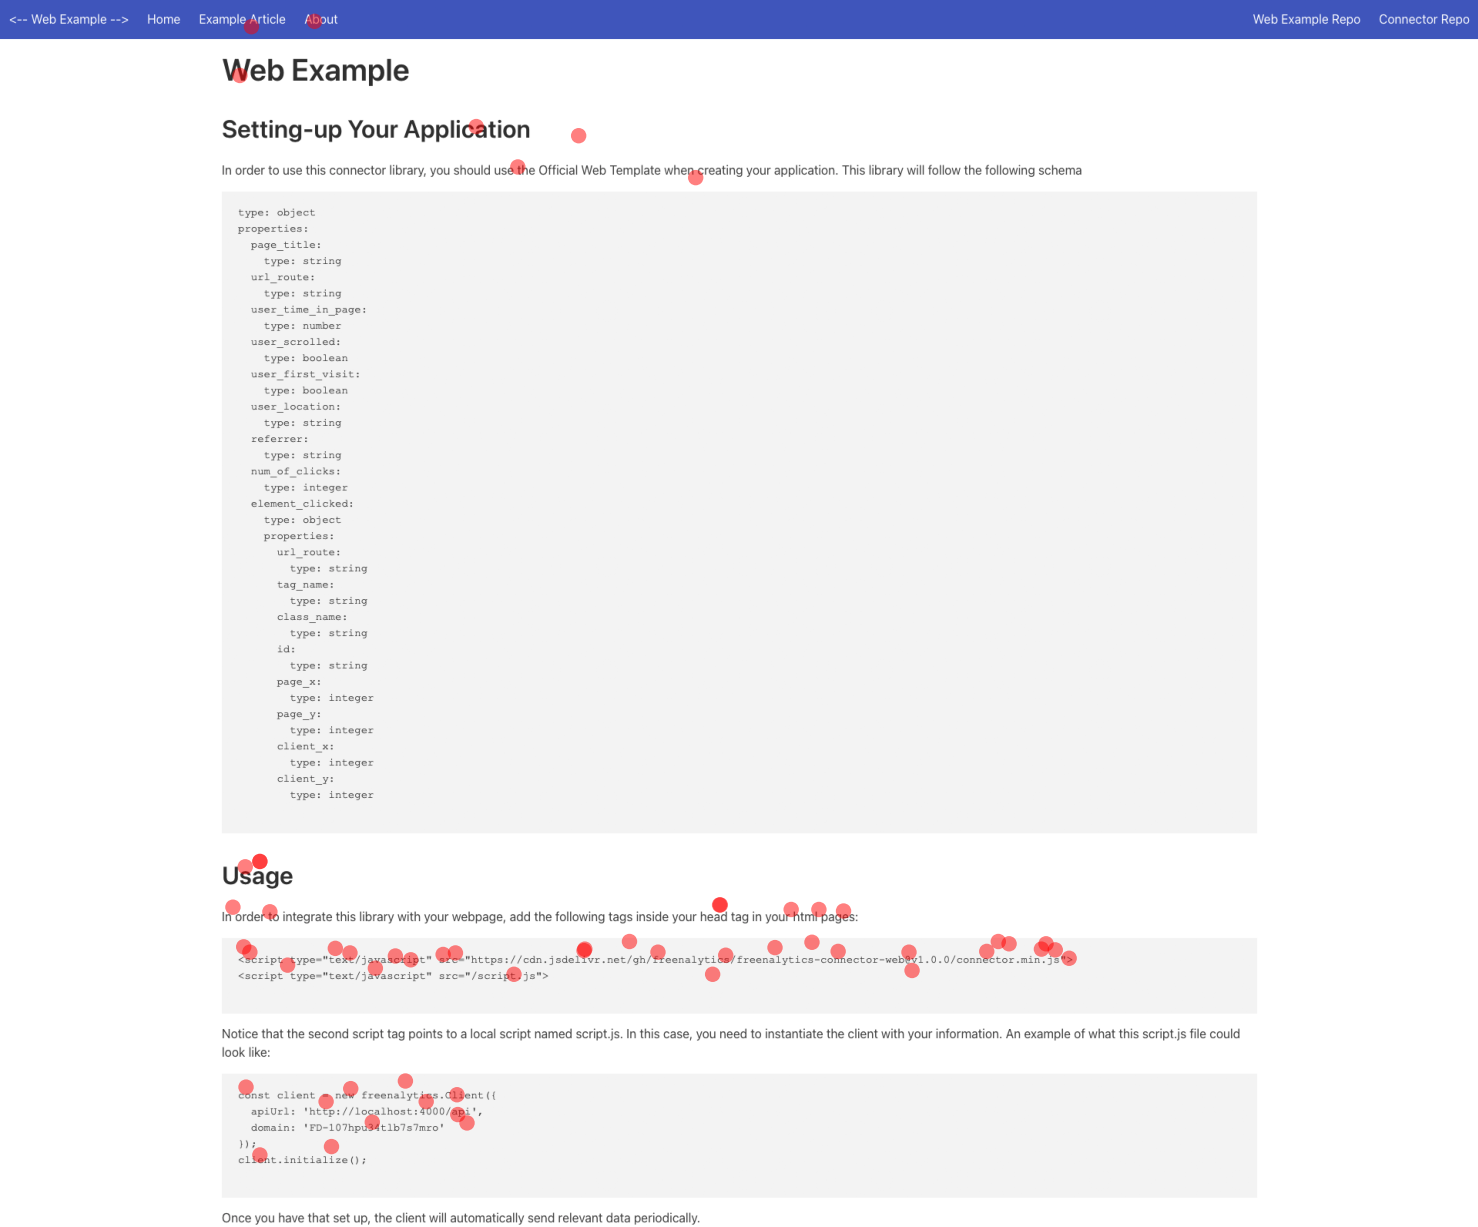
The service features predefined templates for certain types of applications (in this case, web applications), that can work alongside connector libraries that facilitate the integration with this service. Currently only the website connector library exists, which was also written in TypeScript.
As an example, I wrote an example tool written in Python that leverages Selenium to generate a visualization of user clicks in a web page, to display the power of data analysis that this service can provide.
If you're curious about the final document I had to give in, you can read it here (written in Spanish).
Architecture
The main focus of this project was to build something that could easily be self-hosted, since I enjoy doing it so much myself. In this case, each part of the service is independent:
- The backend is an Express REST API written in TypeScript.
- The frontend is a React SPA (built with
create-react-app), also written in TypeScript. - MongoDB was used for the main database for all the service's data.
- A Redis cache is also used to store the data that would be constantly queried to make its retrieval faster.
- Both the backend and frontend are built into a Docker image, so the complete service could easily be hosted using Docker Compose.
As part of the challenge, both the frontend and backend were built with TTD or Test Driven Development, where basically every part of the project would have tests written prior to their implementation.
Additionally, I used GitHub Actions for CI/CD of each part of the project, used for running tests on each PR and building and publishing the Docker image on GitHub Packages on commit pushes.
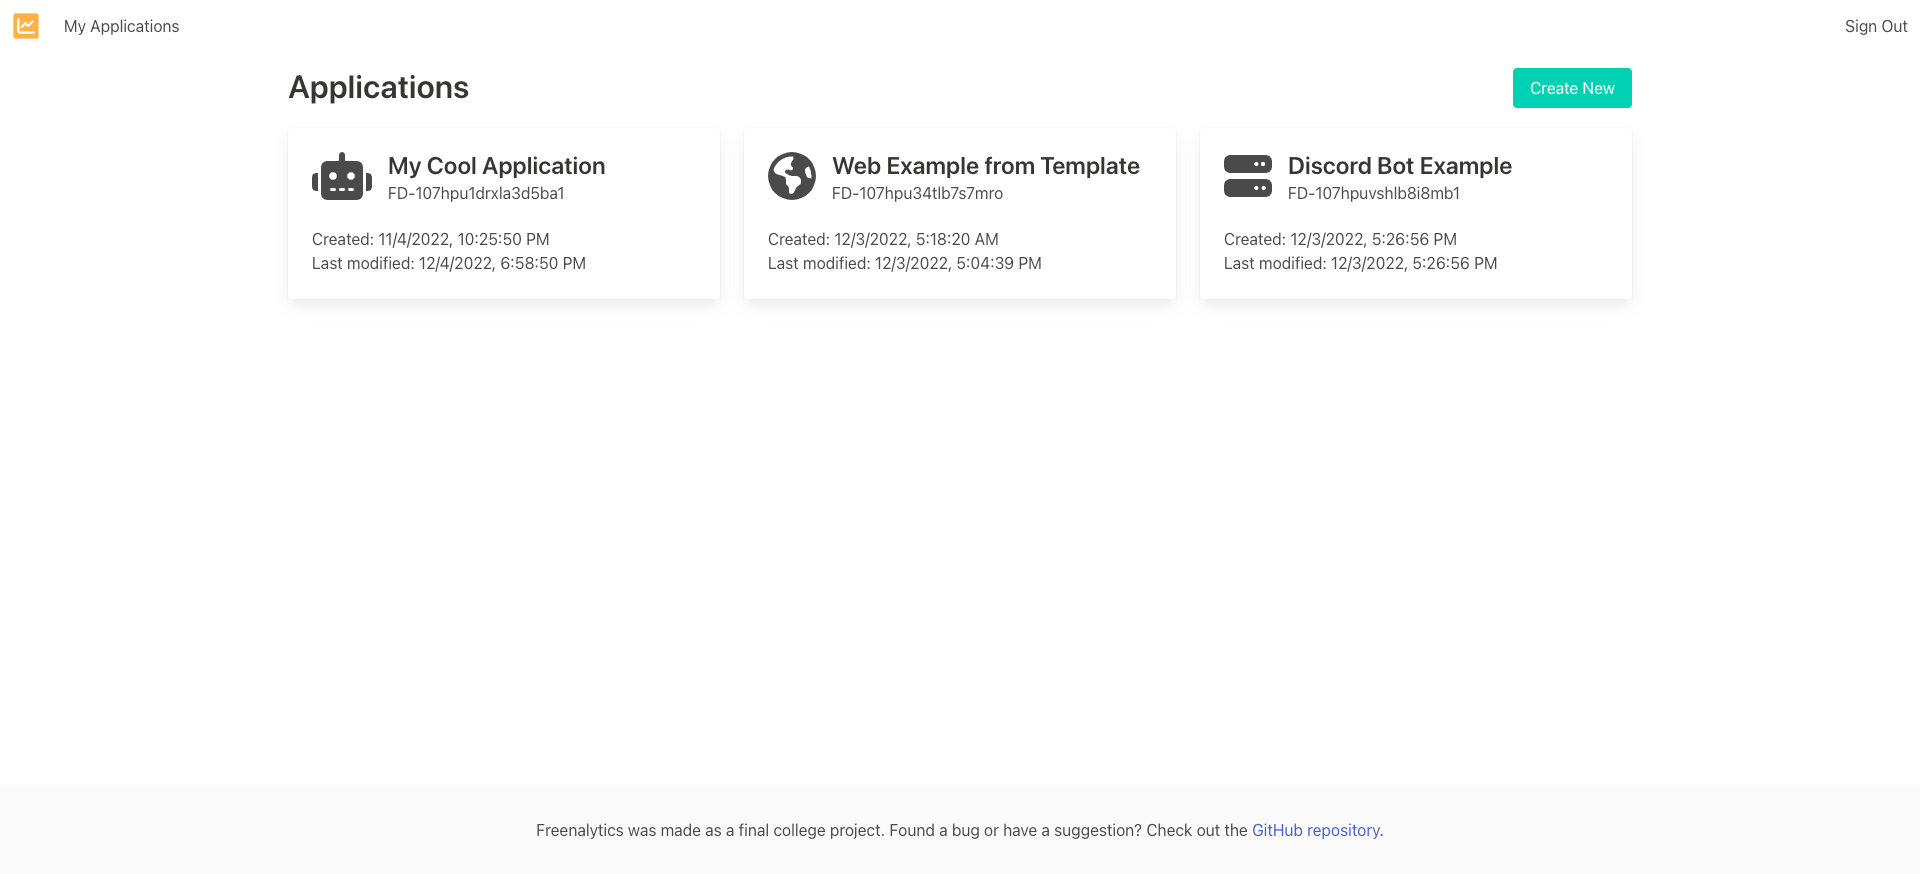
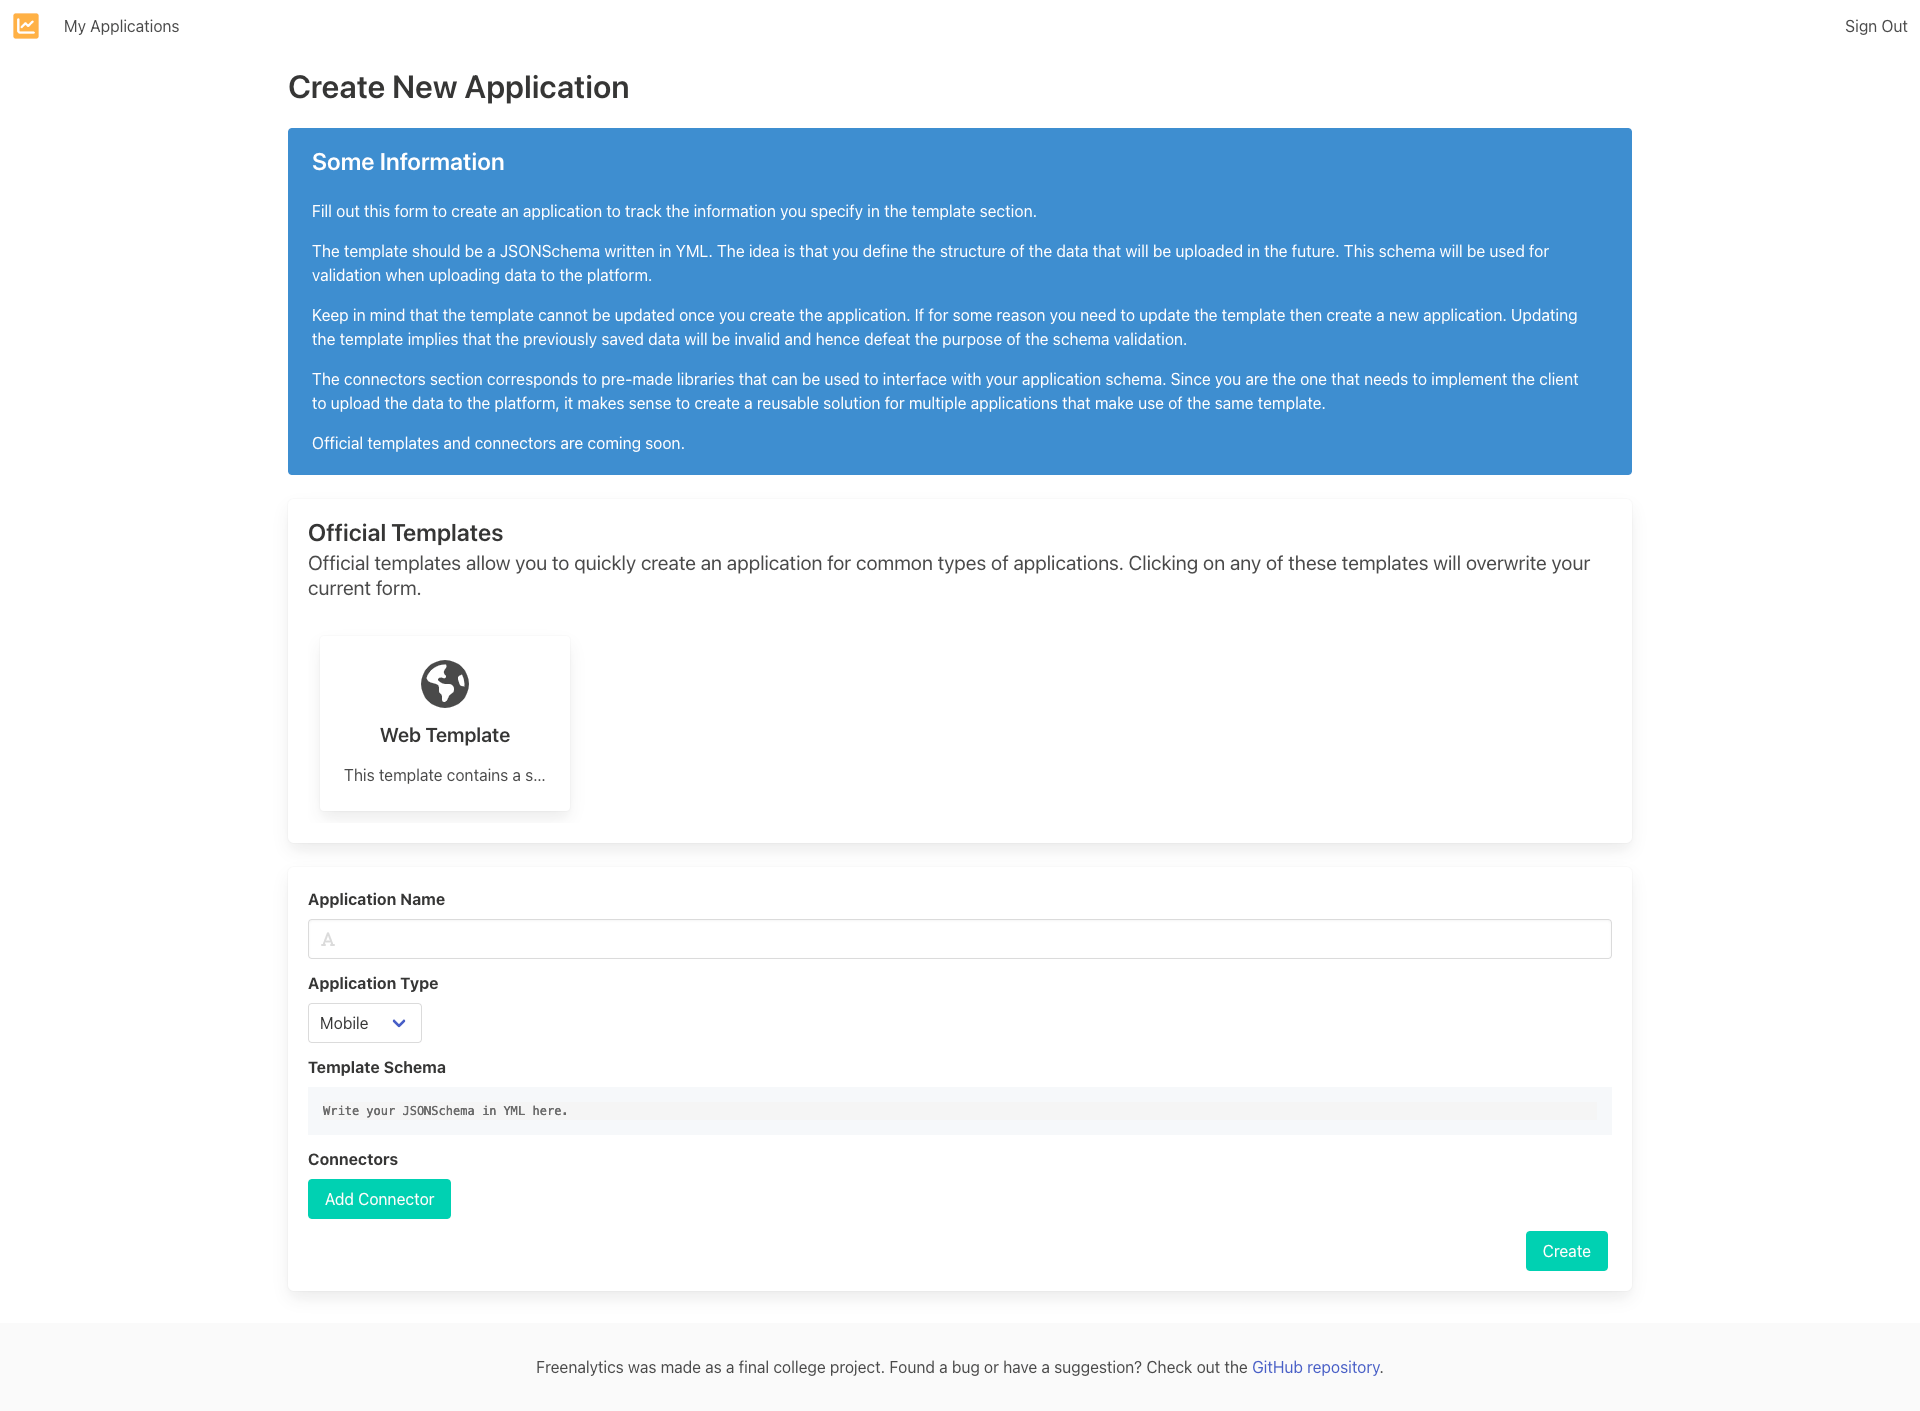
Screenshots
Here's some screenshots that depict what the application looks like.

Data Treatment
As I mentioned before, part of the project included an example tool that could generate click previews of websites tracked by the service. Here's what the tool can generate:
Conclusion
Building this application was a very interesting experience because I learned how to integrate multiple aspects of software development all in a single application. While the application is no longer receiving maintenance, I'm still pretty satisfied with what it ended up as.
I won't go much into detail in here, but if you're curious about this project, check out it's documentation for more detailed information about the way it works and how you can start using it yourself.
Christian (moonstar-x)
Hi there, my name is Christian, also known as moonstar-x online. I enjoy working on a variety of diverse projects, from implementing artistic ideas, contributing in some way to scientific research, or creating simple applications that people can use. I hope you enjoy reading about these projects as much as I enjoy building them!
Quito, Ecuador
